
file:Population of Israel.png

Ii preview ke size: 636 × 599 pixels Duusra resolutions: 255 × 240 pixels | 509 × 480 pixels | 815 × 768 pixels | 1,087 × 1,024 pixels | 1,592 × 1,500 pixels.
Original file (1,592 × 1,500 pixel, file ke size: 165 KB, MIME type: image/png)

|
This graph image could be re-created using vector graphics as an SVG file. This has several advantages; see Commons:Media for cleanup for more information. If an SVG form of this image is available, please upload it and afterwards replace this template with
{{vector version available|new image name}}.
It is recommended to name the SVG file “Population of Israel.svg”—then the template Vector version available (or Vva) does not need the new image name parameter. |
| Baare me |
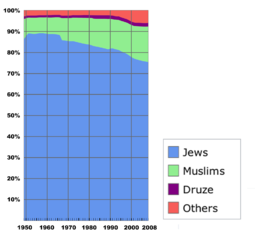
English: Population chart of Israel, by religion, from 1949 to 2008 |
| Taarik | (UTC) |
| Source | |
| Likhe waala |
|
| This is a retouched picture, which means that it has been digitally altered from its original version. Modifications: full chart + fixed fonts. The original can be viewed here: Population of Israel.svg:
|
I, the copyright holder of this work, hereby publish it under the following license:
| I, the copyright holder of this work, release this work into the public domain. This applies worldwide. In some countries this may not be legally possible; if so: I grant anyone the right to use this work for any purpose, without any conditions, unless such conditions are required by law. |
Original upload log
This image is a derivative work of the following images:
- File:Population_of_Israel.svg licensed with PD-self
- 2009-09-17T09:09:11Z Demmo 600x500 (11736 Bytes) {{Information |Description={{en|1=Population chart of Israel, since 1949}} |Source=Own work by uploader |Author=[[User:Demmo|Demmo]] |Date=2009-09-17 |Permission= |other_versions= }} [[Category:Demographics of Israel]]
Uploaded with derivativeFX
Sanchhipt me
Israeli population in thousands. Compiled from data from the Central Bureau of Statistics. [1]
Data 2009 onwards hasn't been added to the "graph".
| ___Year___ | ___Jews___ | ___Muslims___ | ___Druze___ | ___Grand Total___ |
| 1949 | 1,013.9 | 111.5 | 14.5 | 1,173.9 |
| 1950 | 1,203.0 | 116.1 | 15.0 | 1,370.1 |
| 1951 | 1,404.4 | 118.9 | 15.5 | 1,577.8 |
| 1952 | 1,450.2 | 122.8 | 16.1 | 1,629.5 |
| 1953 | 1,483.6 | 127.5 | 16.8 | 1,669.4 |
| 1954 | 1,526.0 | 131.8 | 18.0 | 1,717.8 |
| 1955 | 1,590.5 | 136.2 | 19.0 | 1,789.1 |
| 1956 | 1,667.5 | 141.3 | 19.8 | 1,872.4 |
| 1957 | 1,762.8 | 146.8 | 20.5 | 1,976.0 |
| 1958 | 1,810.2 | 152.8 | 21.4 | 2,031.7 |
| 1959 | 1,858.8 | 159.2 | 22.3 | 2,088.7 |
| 1960 | 1,911.3 | 166.3 | 23.3 | 2,150.4 |
| 1961(4) | 1,981.7 | 174.9 | 26.3 | 2,234.2 |
| 1962 | 2,068.9 | 183.0 | 27.3 | 2,331.8 |
| 1963 | 2,155.6 | 192.2 | 28.5 | 2,430.1 |
| 1964 | 2,239.2 | 202.3 | 28.6 | 2,525.6 |
| 1965 | 2,299.1 | 212.4 | 29.8 | 2,598.4 |
| 1966 | 2,344.9 | 223.0 | 31.0 | 2,657.4 |
| 1967 | 2,383.6 | 289.6 | 32.1 | 2,776.3 |
| 1968 | 2,434.8 | 300.8 | 33.3 | 2,841.1 |
| 1969 | 2,506.8 | 314.5 | 34.6 | 2,929.5 |
| 1970 | 2,582.0 | 328.6 | 35.9 | 3,022.1 |
| 1971 | 2,662.0 | 344.0 | 37.3 | 3,120.7 |
| 1972(4) | 2,752.7 | 360.6 | 37.8 | 3,225.0 |
| 1973 | 2,845.0 | 377.2 | 39.3 | 3,338.2 |
| 1974 | 2,906.9 | 395.2 | 40.8 | 3,421.6 |
| 1975 | 2,959.4 | 411.4 | 42.2 | 3,493.2 |
| 1976 | 3,020.4 | 429.0 | 43.9 | 3,575.4 |
| 1977 | 3,077.3 | 446.5 | 45.6 | 3,653.2 |
| 1978 | 3,141.2 | 463.5 | 47.3 | 3,737.6 |
| 1979 | 3,218.4 | 481.2 | 49.0 | 3,836.2 |
| 1980 | 3,282.7 | 498.3 | 50.7 | 3,921.7 |
| 1981 | 3,320.3 | 513.7 | 52.3 | 3,977.7 |
| 1982 | 3,373.2 | 530.8 | 65.6 | 4,063.6 |
| 1983(4) | 3,412.5 | 542.2 | 68.0 | 4,118.6 |
| 1984 | 3,471.7 | 559.7 | 70.0 | 4,199.7 |
| 1985 | 3,517.2 | 577.6 | 72.0 | 4,266.2 |
| 1986 | 3,561.4 | 595.0 | 74.0 | 4,331.3 |
| 1987 | 3,612.9 | 614.5 | 76.1 | 4,406.5 |
| 1988 | 3,659.0 | 634.6 | 78.1 | 4,476.8 |
| 1989 | 3,717.1 | 655.2 | 80.3 | 4,559.6 |
| 1990 | 3,946.7 | 677.7 | 82.6 | 4,821.7 |
| 1991 | 4,144.6 | 701.4 | 84.8 | 5,058.8 |
| 1992 | 4,242.5 | 725.4 | 87.1 | 5,195.9 |
| 1993 | 4,335.2 | 751.4 | 89.3 | 5,327.6 |
| 1994 | 4,441.1 | 781.5 | 91.7 | 5,471.5 |
| 1995(4) | 4,522.3 | 811.2 | 92.2 | 5,612.3 |
| 1996 | 4,616.1 | 839.9 | 94.5 | 5,757.9 |
| 1997 | 4,701.6 | 867.9 | 96.7 | 5,900.0 |
| 1998 | 4,785.1 | 899.8 | 99.0 | 6,041.4 |
| 1999 | 4,872.8 | 934.1 | 101.2 | 6,209.1 |
| 2000 | 4,955.4 | 970.0 | 103.8 | 6,369.3 |
| 2001 | 5,025.0 | 1,004.6 | 106.3 | 6,508.8 |
| 2002 | 5,094.2 | 1,038.3 | 108.5 | 6,631.1 |
| 2003 | 5,165.4 | 1,072.5 | 110.8 | 6,748.4 |
| 2004 | 5,237.6 | 1,107.4 | 113.0 | 6,869.5 |
| 2005 | 5,313.8 | 1,140.6 | 115.2 | 6,990.7 |
| 2006 | 5,393.4 | 1,173.1 | 117.5 | 7,116.7 |
| 2007 | 5,478.2 | 1,206.1 | 119.7 | 7,243.6 |
| 2008 | 5,569.2 | 1,240.0 | 121.9 | 7,374.0 |
| 2009 | 5,685.8 | 1,275.2 | 124.4 | 7,535.0 |
| 2010 | 5,806.5 | 1,311.4 | 127.0 | 7,701.3 |
| 2011 | 5,928.0 | 1,346.7 | 129.5 | 7,867.6 |
| 2012 | 6,053.4 | 1,382.7 | 131.9 | 8,038.5 |
| 2013 | 6,180.5 | 1,417.5 | 134.3 | 8,209.74 |
File ke itihaas
File ke dekhe khatir, jaise uu time dekhe me lagat rahaa, date/time pe click karo.
| Din/Time | Chhota chapa | Lambai aur chaurai | Sadasya | Tiprrin | |
|---|---|---|---|---|---|
| abhi waala | 05:28, 29 Juun 2010 | | 1,592 × 1,500 (165 KB) | TheCuriousGnome | {{Information |Description={{en|1=Population chart of Israel, since 1949}} |Source=*File:Population_of_Israel.svg |Date=2010-06-29 05:27 (UTC) |Author=*File:Population_of_Israel.svg: Demmo *derivative work: ~~~ |Permission=see b |
File ke kaise kaam me lawa gais hae
Ii file ke koi panna kaam me nai laae hai.
Global file usage
Ii aur duusra wiki ii file ke use kare hai:
- en.wikipedia.org pe upyog
- eu.wikipedia.org pe upyog
- fa.wikipedia.org pe upyog
- nn.wikipedia.org pe upyog
- te.wikipedia.org pe upyog
- zh.wikipedia.org pe upyog